Not too long ago I had a strange conversation with someone about immigration. Seeing as I’m someone who talks about data and statistics a fair amount – particularly the dodgy kind – they were asking me if I could confirm their suspicion that some figures they’d seen recently were bogus. It went something like this:
“You said that the immigration figures were wrong in the past, right? Because they were miscounting?”
Me: “Sure, a lot of people were missed from the statistics at one point in the past.”
“Because I saw a chart recently that looked totally unrealistic. You’re saying the figures are probably wrong?”
“I mean, not as a rule. But yes, even the revised figures from that time might not tell the full story.”
“I thought so. Because I saw a chart that went like this [mimes a Sugarloaf Mountain in the air] and I thought that couldn’t be right.”
I left this conversation a little perturbed, not quite sure what reassurance I’d given this person. We were talking at cross purposes, and I think what I’d unwittingly done was to give them license to doubt any immigration statistics they saw which didn’t fit with other things they believed to be true.
It was that Sugarloaf Mountain that stuck with me. What I had meant to refer to when talking about immigration statistics being inaccurate was a period during the 2000s when our official figures were undercounting Eastern Europeans coming to the UK (which I wrote about in Bad Data and have talked about here).
It’s clear to me now that my conversation partner was talking about this:
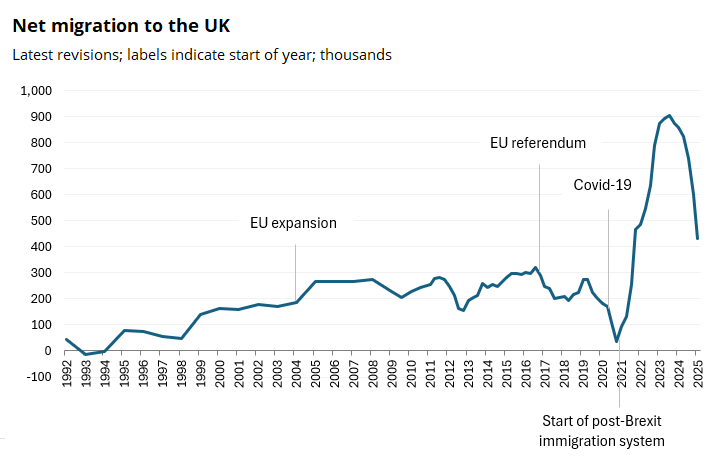
Those are the latest official estimates of net migration to the UK. That means the number of people coming to live in the UK long-term (at least a year) minus the number leaving to live abroad, in a given year.
What I’m realising is there’s a problem with the way we have conversations about immigration at the moment and it centres around this chart. The issue is that when a lot of people look at it – both on the left and right of the political spectrum – a kind of cognitive dissonance kicks in which means they can’t process the full picture.
But let me lay out what the data shows:
-
Migration is thought to have added 800,000-900,000 people to the population per year in both 2022 and 2023.
-
This was a lot more people than usual, considering the migration levels of the past.
-
The numbers have been consistently falling since then: 2022 and 2023 did not turn out to be the new normal.
There are reasons for that spike in migration but I’m not going to get into them because my point is that, first and foremost, the numbers have to be accepted as broadly true.
I’m looking in particular at people on the left, who have an especially Poppins-like bag of caveats at the ready to distract from confronting the numbers. But the right also have a tendency to ignore that last point. Overall migration has definitely been falling.
Let’s put the figures into a longer term context shall we? Here’s a chart showing annual population change, which takes into account births, deaths, and migration since 1838. Note that I couldn’t get the figures for the whole of the UK. Of course what immediately sticks out are the gargantuan population shifts around both of the world wars, when millions of people first left the UK, largely to serve overseas, and then returned.
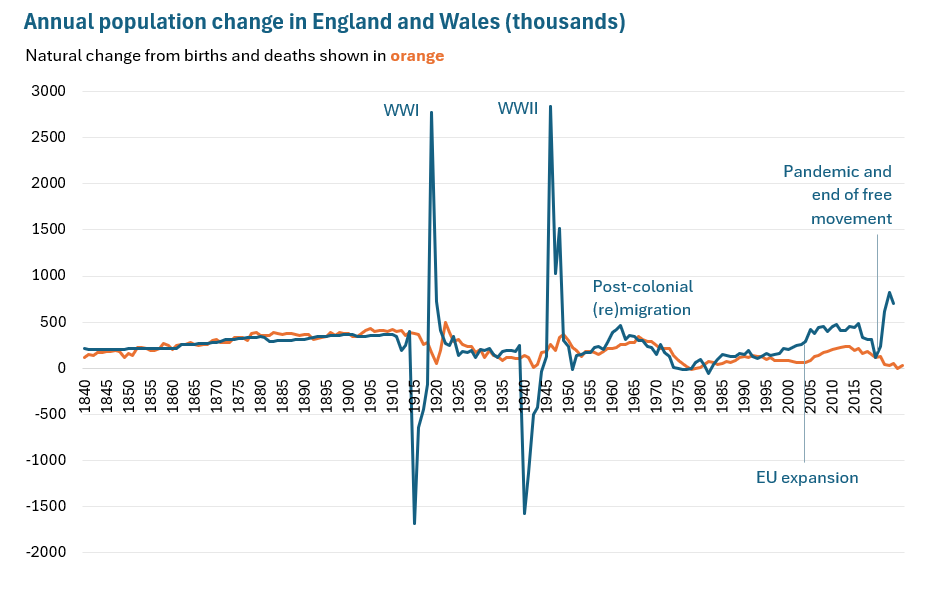
Since 2004, peace-time population growth has been at a historic high, similar to that during the ‘Windrush’ years of the early 1960s. After the pandemic and under a new, post-Brexit immigration system, it rose further then started to fall (this chart doesn’t show how far it has since fallen because these are mid- rather than end-of-year figures).
It’s another kind of chart that will provoke a sharp intake of breath, particularly from people on the left. There are many such charts that contradict or confirm a strongly-held opinion or that expose what in one’s view is an inconvenient truth. The worst thing to do is shrink and look away.
Confronting the awkward
Statistics can be spun to make a political point – my conversation partner at the start of this piece was right about that. They can also be inaccurate, or miss the mark in terms of recording what’s most pertinent to know. But just because they can be flawed, that doesn’t give us license to dismiss them at will.
Even if statistics end up being revised, which is a common occurrence, when we’re having debates we need to at least all be looking at the same numbers as they appear in the moment.
But while I’m talking about statistics as if everyone is looking at the numbers as they appear in a spreadsheet, the reality is also that we mostly receive messaging about numbers second- or third-hand.
That’s allowed another big area of misinformation to grow about the share of migration which is by illegal routes. A YouGov poll from earlier this year showed that close to half of people think there are more migrants living illegally than legally in the UK:
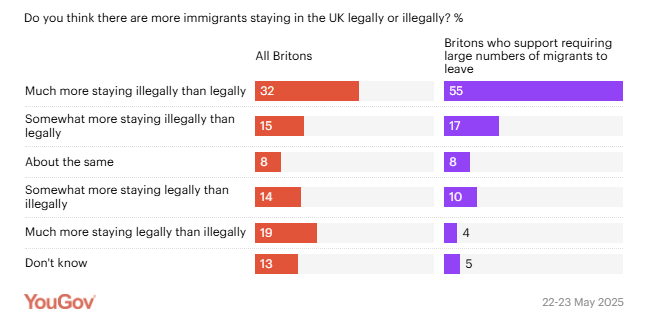
This is just not accurate by any stretch. Although the data on this is somewhat fuzzy, people living in the UK without the right to likely make up a small share of all migrants. There’s another enduring impression that most people come to the UK by illegal means when, if we look at the latest full year of data, it was only around 4% (40,000 irregular migrants compared with 948,000 regular ones).
Again, although the numbers are a little harder to come by on this topic, I’ve noticed a tendency for people to just not compute when the statistics don’t match their perception. Migration sceptics feel like there must be a catch or a caveat around that 4%; migration liberals downplay the fact that 4% and tens of thousands per year is still more than none.
Statistician advises to ignore the numbers
Ok, so I’m not actually saying to ignore the numbers. But it’s awkward and difficult to have conversations when there’s a shaky grasp of numerical facts on both sides. It makes me think of the climax of TV show Gladiators in which two contenders try to whack each other down from a wobbly pole.

And given that it’s so easy to carry around a vague and quite inaccurate picture of the numerical truth around in our heads, how would things go if we didn’t make it that so central to how we form and articulate opinions?
Since we’re talking about immigration here, is it the numbers that are so outrageous/ insufficient/ perfectly fine [delete as appropriate] or are we are each using them to illustrate an argument that’s based on something else we’ve experienced or heard?
After all, we might believe that 800,000 people have migrated to the UK but we don’t encounter them all personally. What is our personal view really shaped by?
More likely than statistics, it will be a series of real life experiences and encounters that have left an impression. The cost of living, waiting times for doctor’s appointments, difficulty finding affordable housing, sympathy for a friend or family member, good or bad experiences with colleagues, difficulty recruiting workers or finding customers, a feeling of community or the loss of that, gratitude and/ or resentment towards strangers.
In each case, bringing numbers into the argument probably isn’t going to change how someone feels. An arms race of cherry-picked statistics rarely succeeded in changing anyone’s mind.
Let’s keep the basic facts straight and try understanding what else is driving people’s strong opinions, especially when they run counter to our own.
Originally published on Substack: https://georginasturge.substack.com/p/how-to-make-conversations-about-immigration